

Here are July’s year-over-year trends, based on aggregated data from thousands of independent retail jewelers across the U.S.
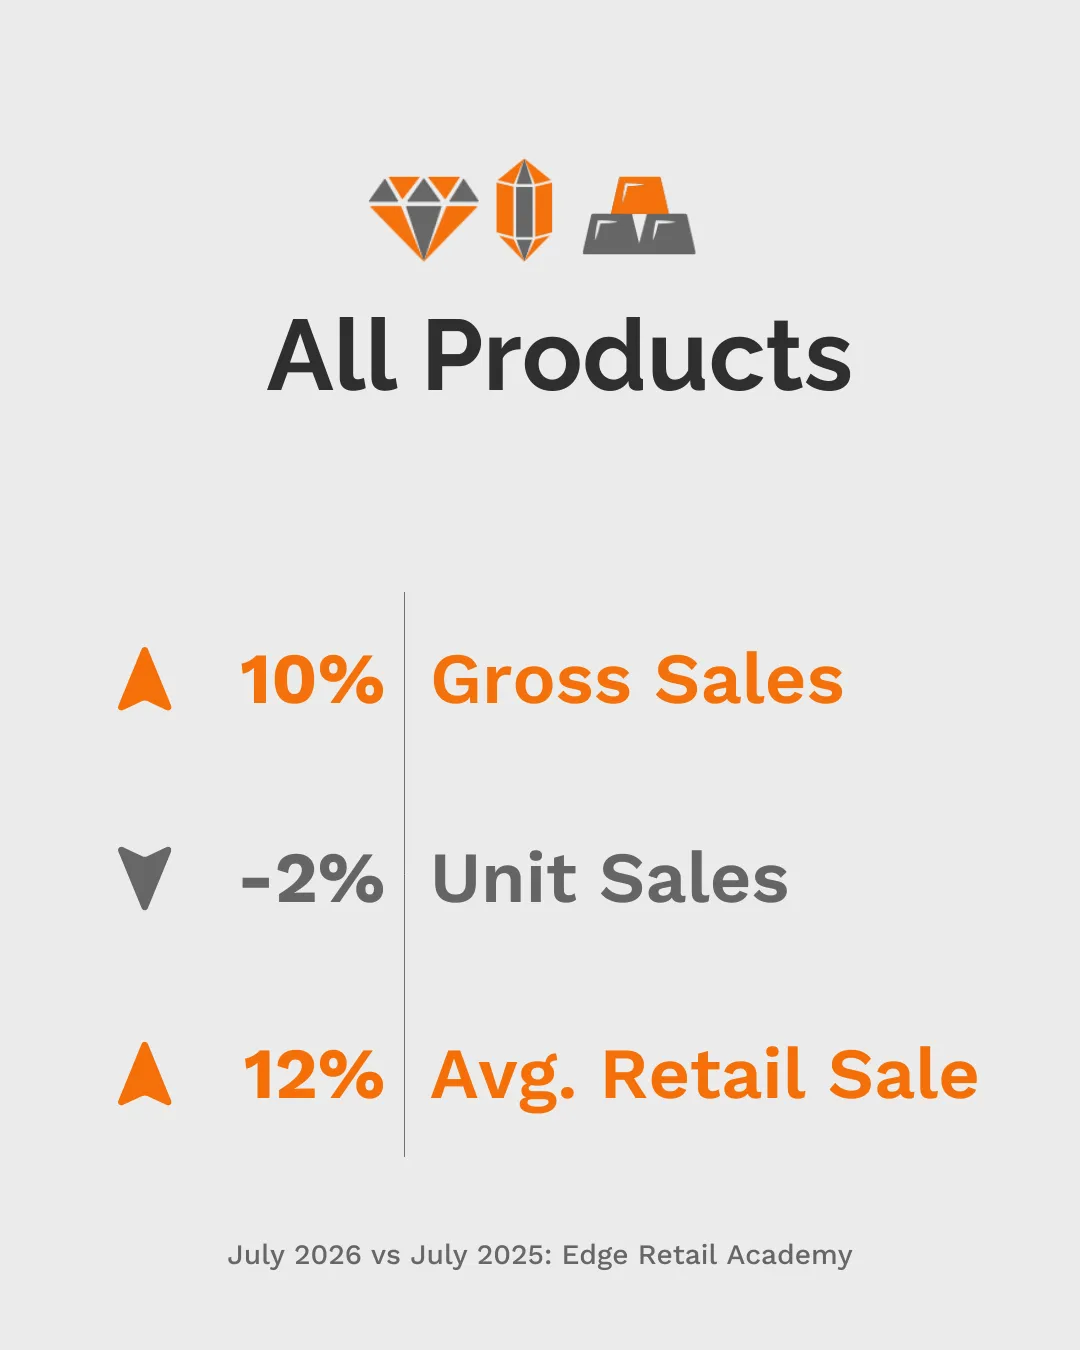
July delivered another positive month for independent retail jewelers, with gross sales increasing 10% compared to July 2025. While that reflects continued year-over-year growth, it marks a softer result than June, when gross sales increased 18% and unit sales were flat. The key shift in July was the return of modest unit softness. Unit sales declined 2%, while average retail sale increased 12%, showing that higher average transaction values continued to support performance.
This keeps the broader trend intact, but at a more moderate pace. Customers are still spending, but growth is not being driven by a meaningful increase in items sold. Instead, July’s performance points to continued reliance on stronger average retail sale to offset lower unit movement. Compared to June, July appears less broadly strong, but still healthy from a revenue perspective.
Category Insights
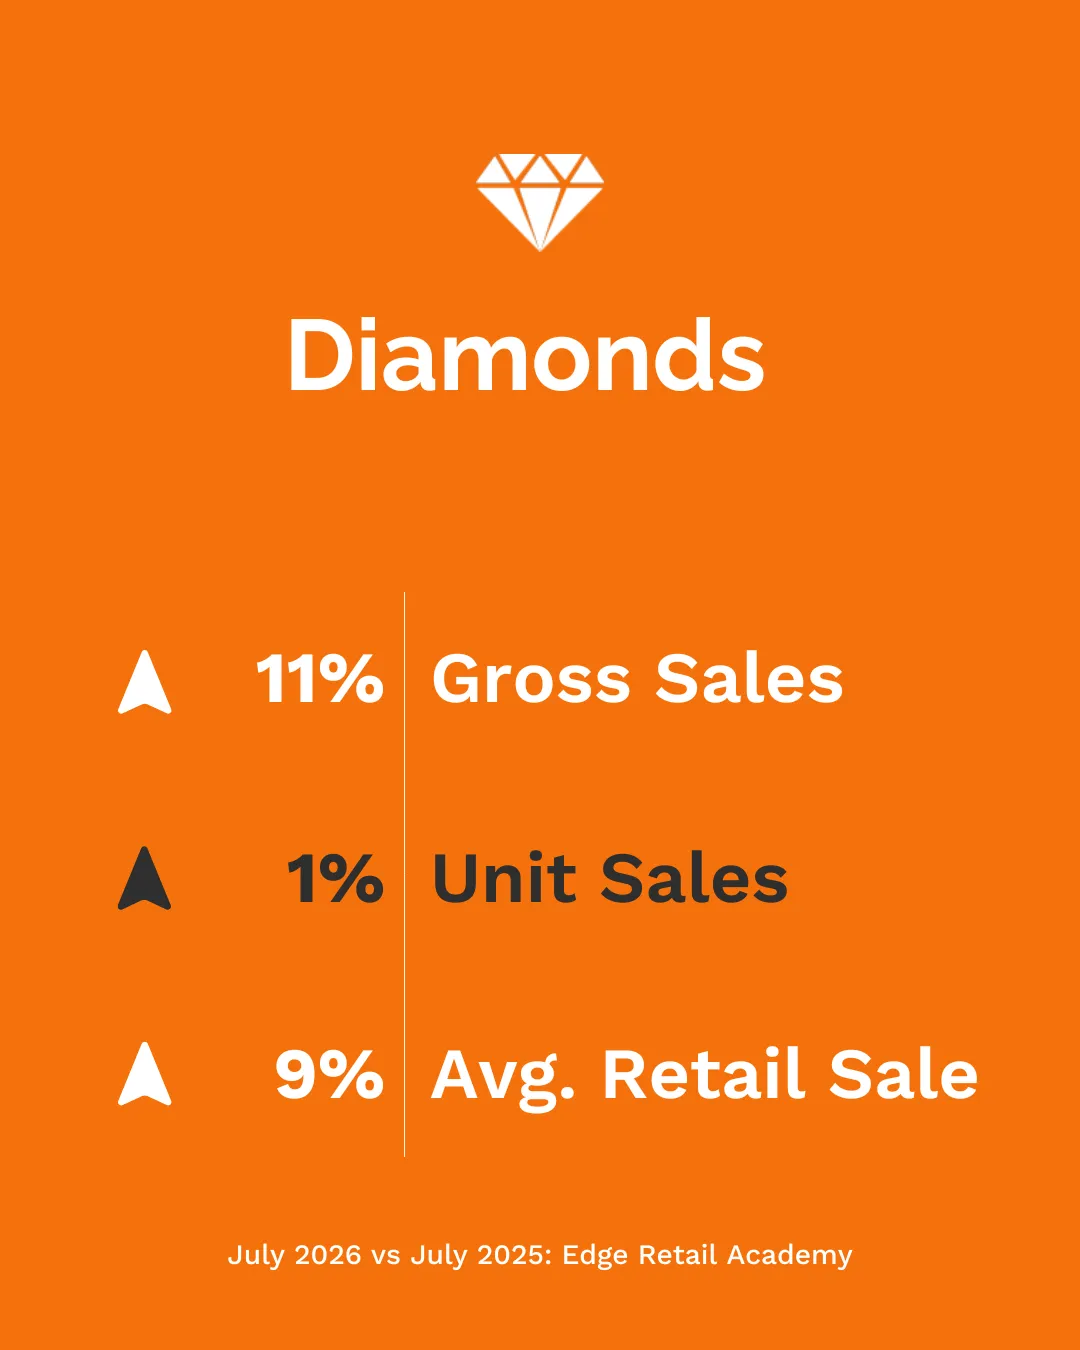
Diamonds delivered one of the steadier performances of the month, with gross sales up 11%, units up 1%, and average retail sale increasing 9%. Unlike several other highlighted categories, diamonds posted both sales growth and slight unit growth, suggesting more balanced performance than earlier months.
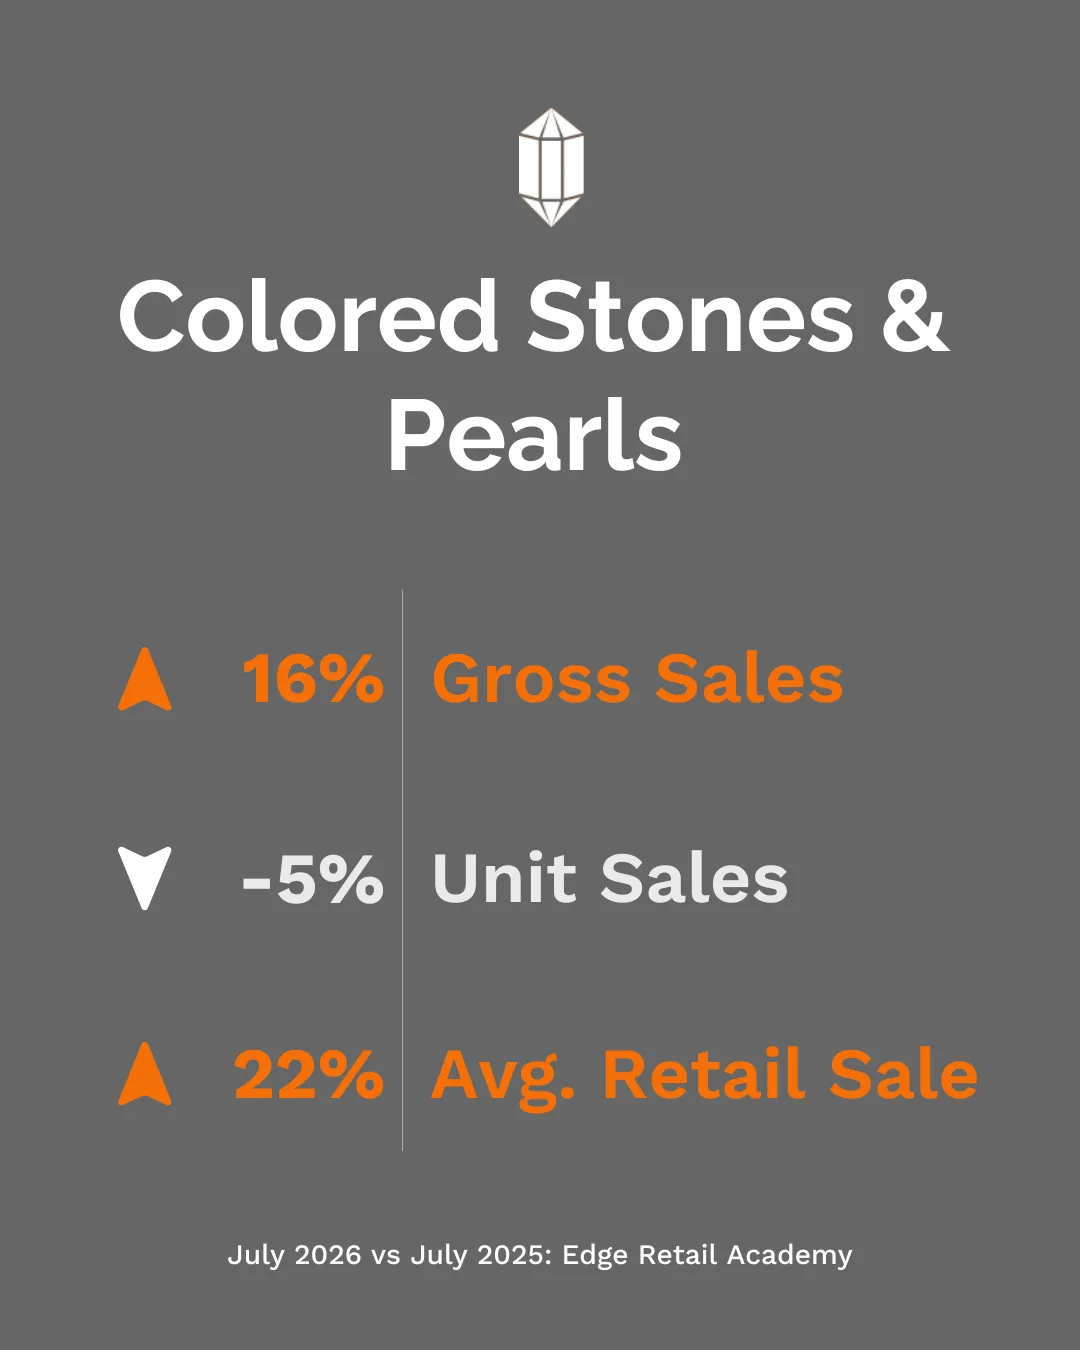
Colored Stones & Pearls remained the strongest highlighted category, with gross sales up 16% and average retail sale increasing 22%, despite a 5% decline in units. The category continues to show strength through higher-value purchases, although growth moderated from June’s stronger performance.
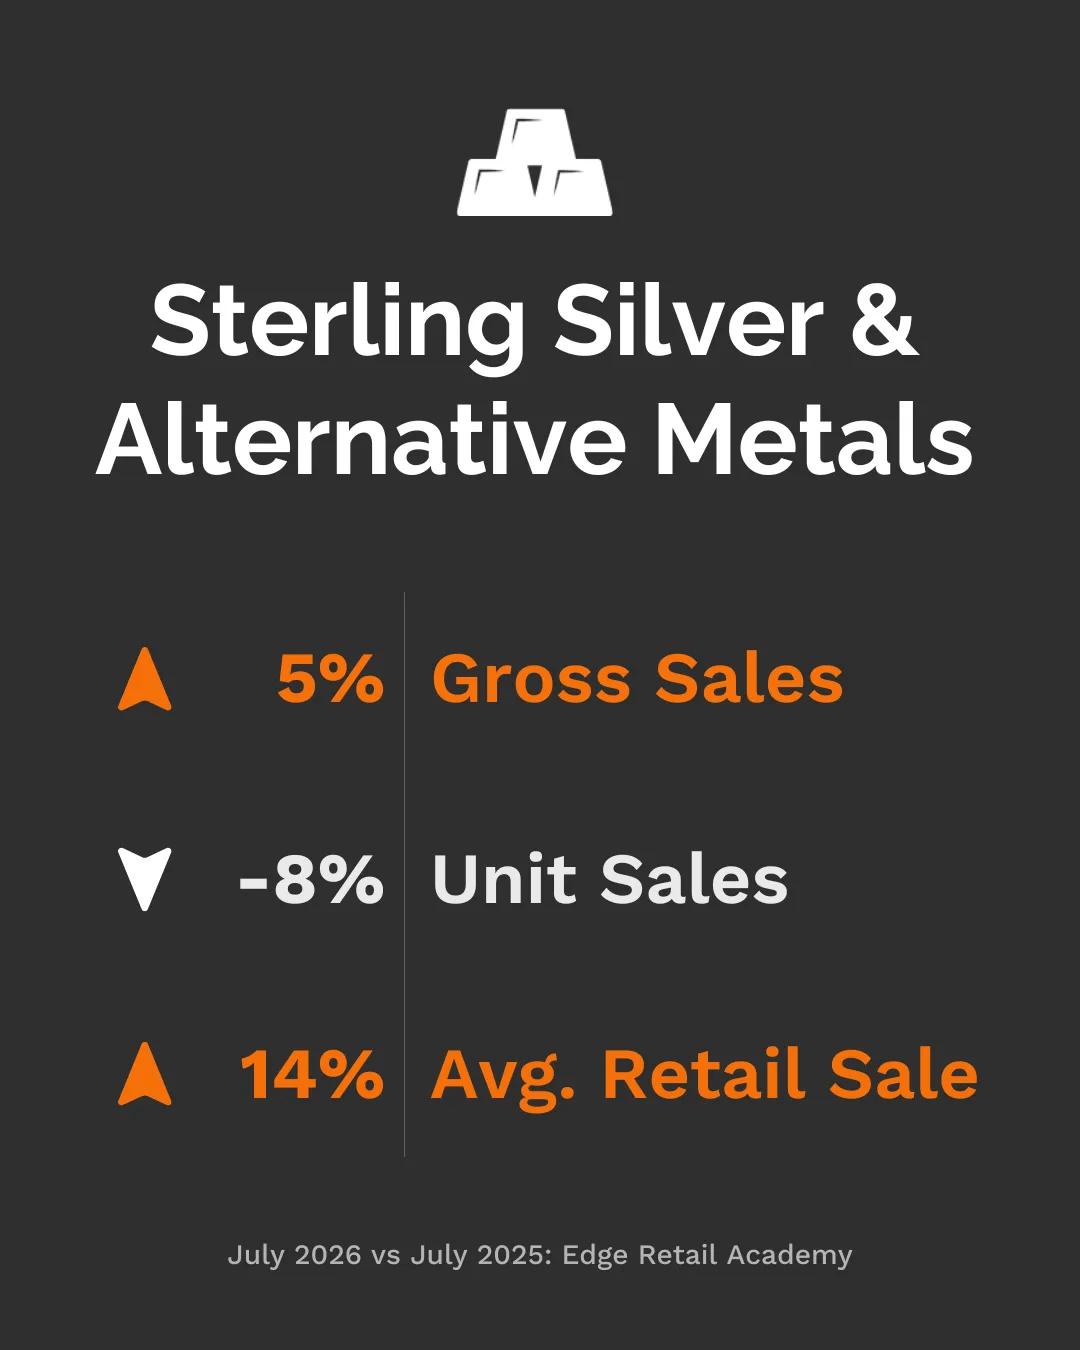
Sterling Silver & Alternative Metals posted a 5% sales increase, while units declined 8% and average retail sale rose 14%. Higher average values helped offset softer unit movement, but the category continues to show more pressure on volume than the other highlighted segments.
Overall, July reflects continued revenue growth supported by higher average retail sale, but with more unit softness than June. The strongest signal is that retail jewelers are still generating larger transactions, though category performance is becoming more mixed.
 |
 |
 |
 |
Not Sure How Your Store Compares?
Industry trends are useful, but your own numbers tell the story that matters most. A complimentary Store Performance Analysis gives retail jewelers a clear, data-driven look at how their business is performing and where opportunities may exist to improve sales, inventory, profitability, and cash flow.