
Commentary from Our Experts:
April continued to build on the trend established earlier this year, with independent retail jewelers delivering another strong top-line performance.
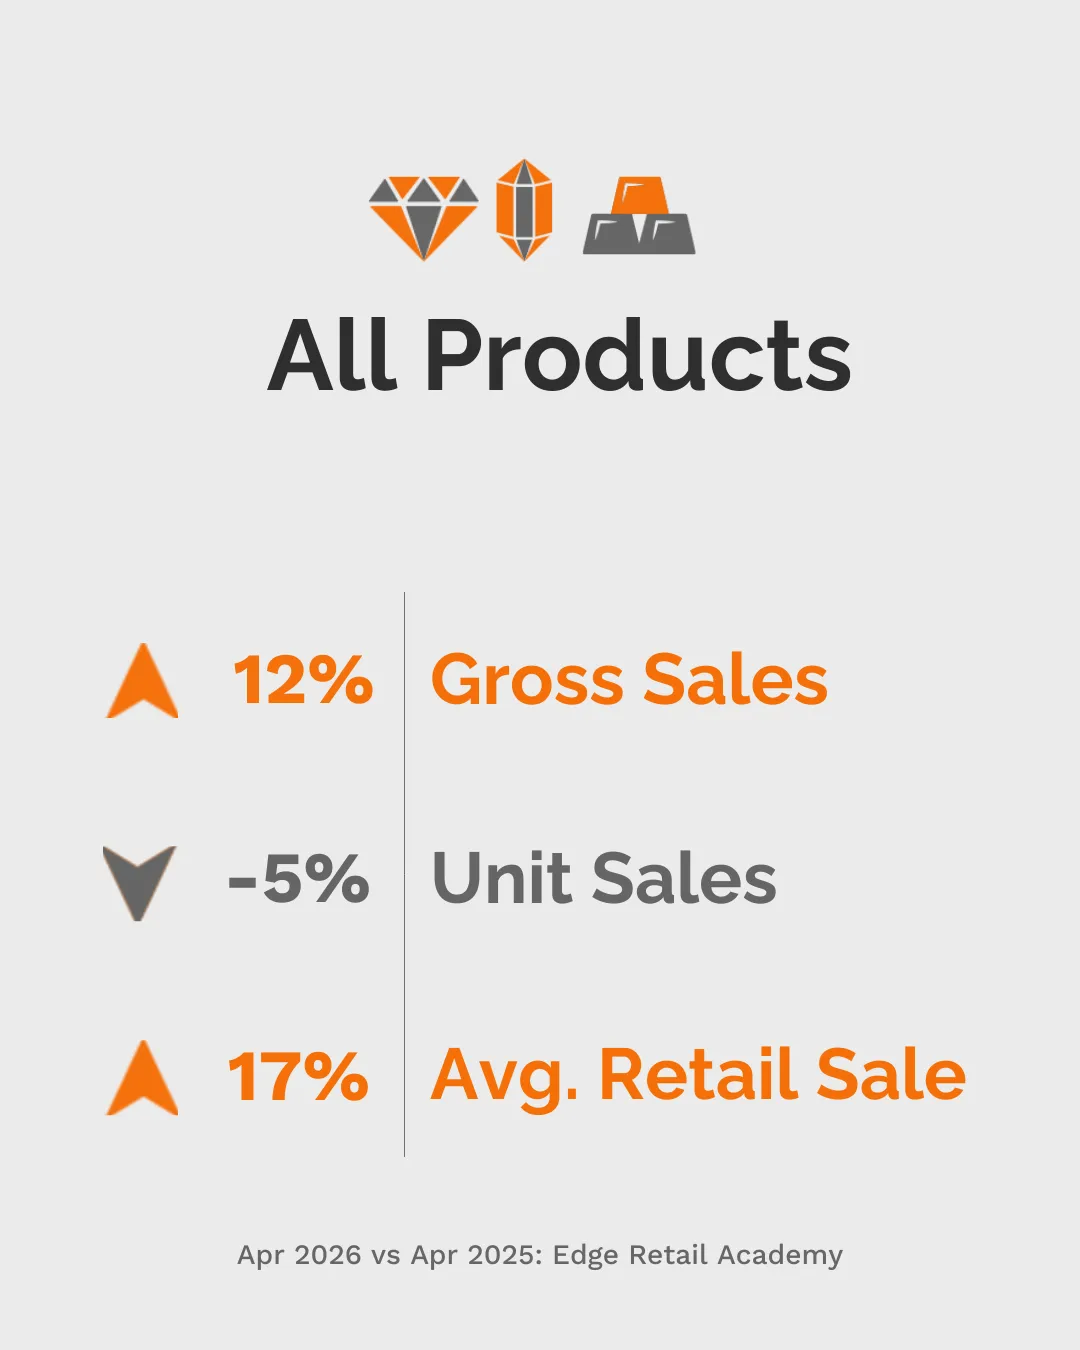
Gross sales increased 12% for the month, signaling healthy revenue growth across the industry. However, that growth was not driven by volume. Unit sales declined 5%, while average retail sale rose 17%, clearly indicating that higher transaction values are driving results.
This reinforces a consistent pattern now seen over the last few months. Customers are purchasing fewer items, but spending more per transaction. Growth is being driven by stronger individual sales rather than increased traffic or transaction count, placing greater importance on each selling opportunity.
Category performance reflects this dynamic:
-
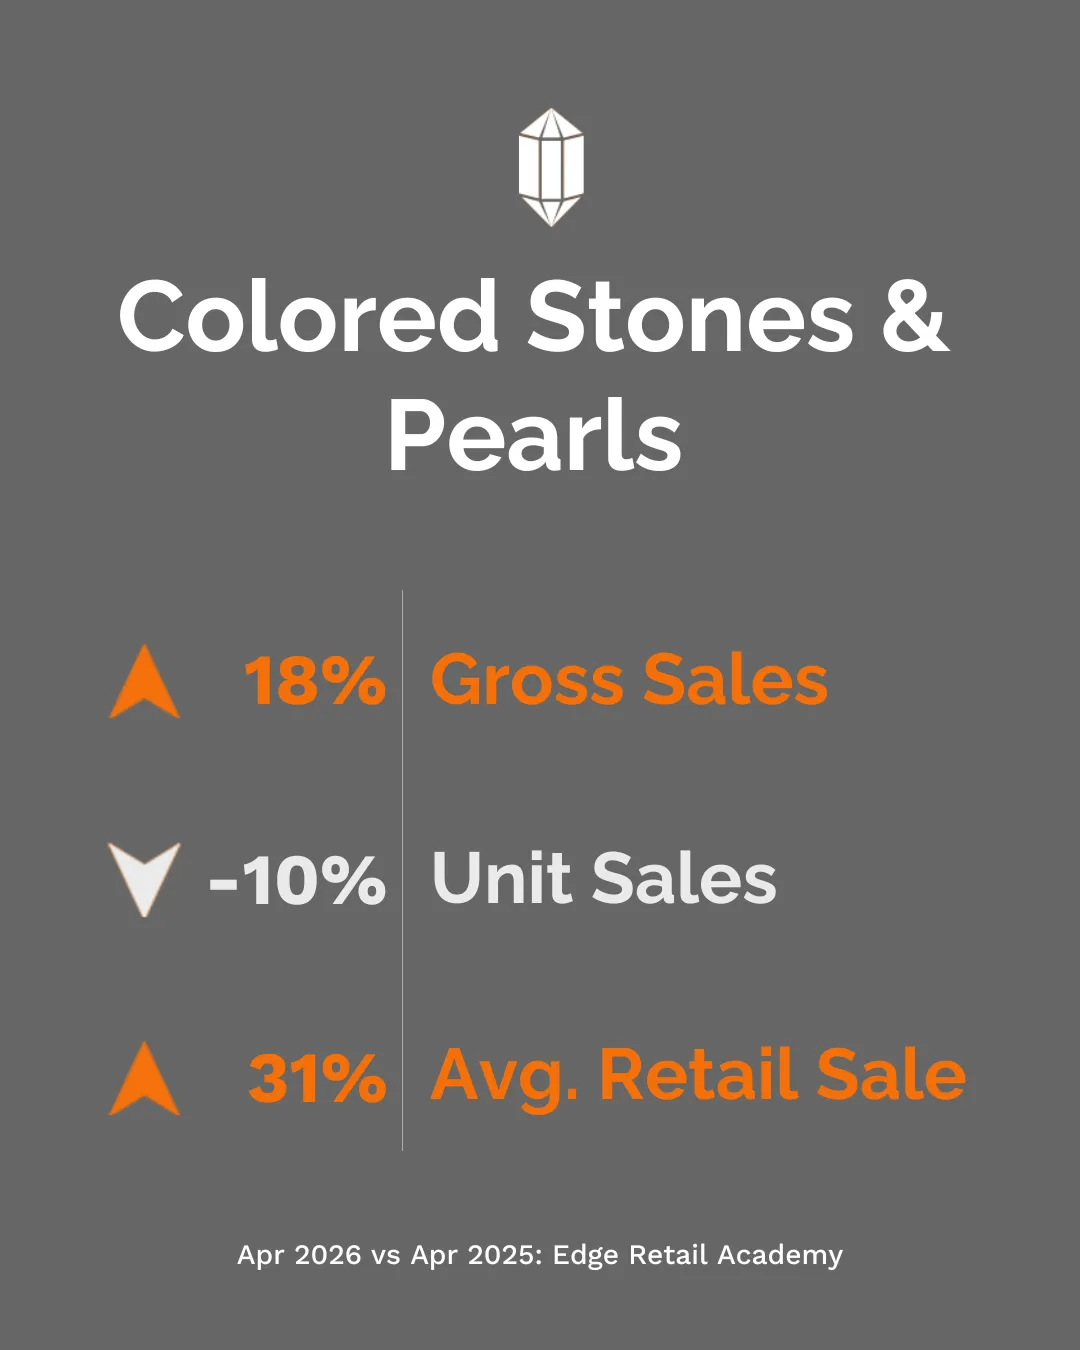
Colored stones and pearls led the month, with sales up 18% and average retail sale increasing 31%, despite a 10% decline in units. This category continues to support larger transactions and drive overall performance.
-
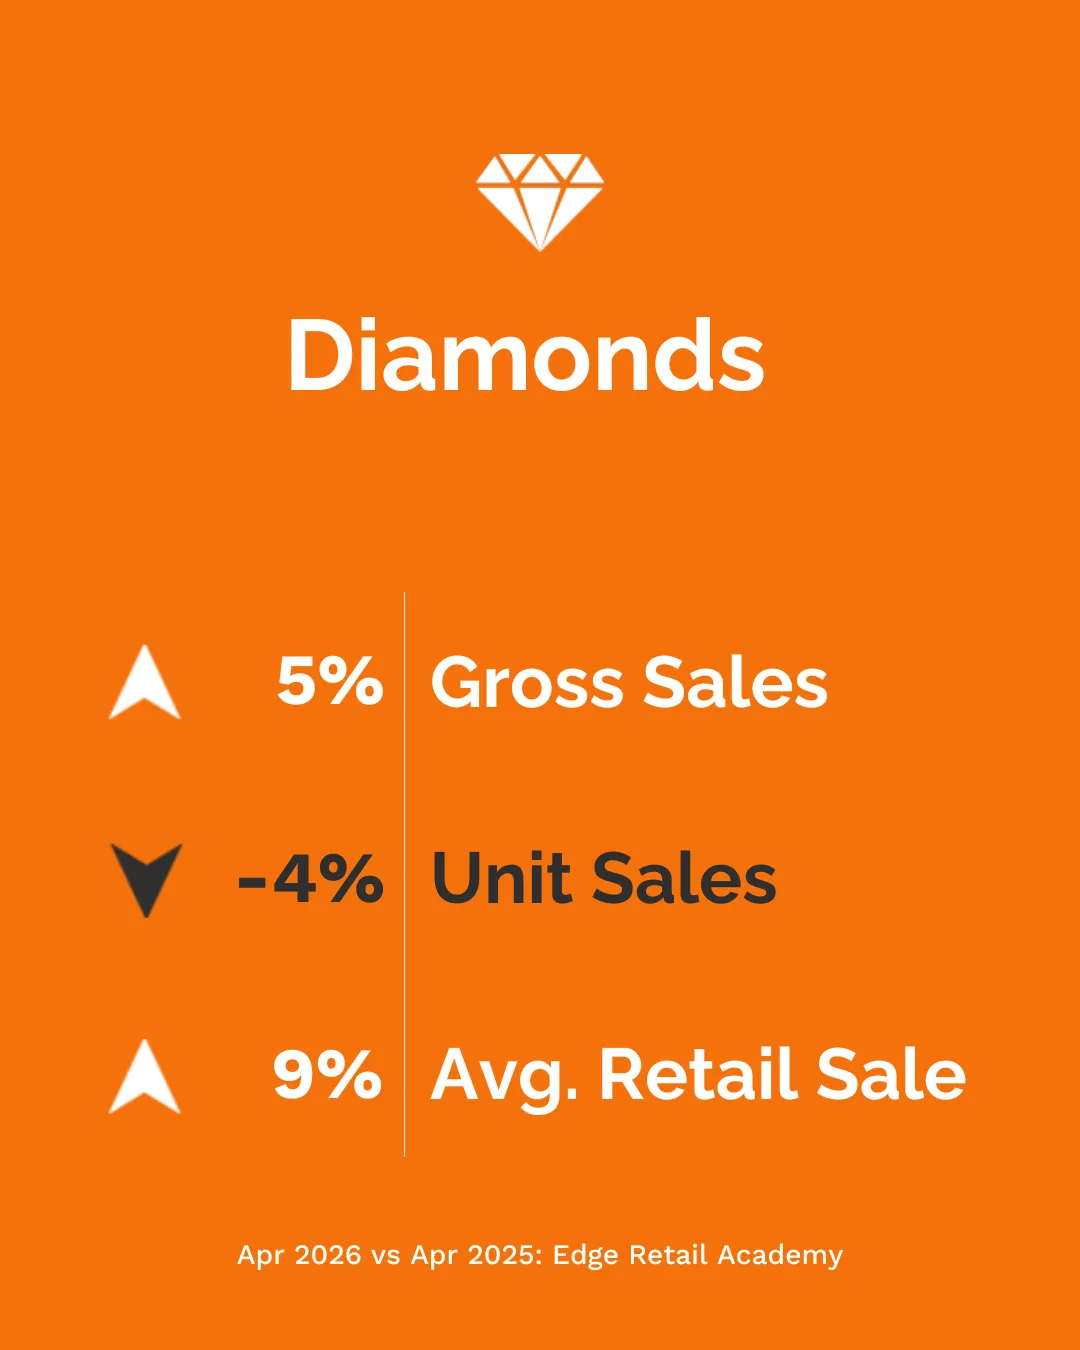
Diamonds delivered more moderate growth at +5% in sales, supported by a 9% increase in average retail sale and a 4% decline in units, indicating steady demand in core product.
-
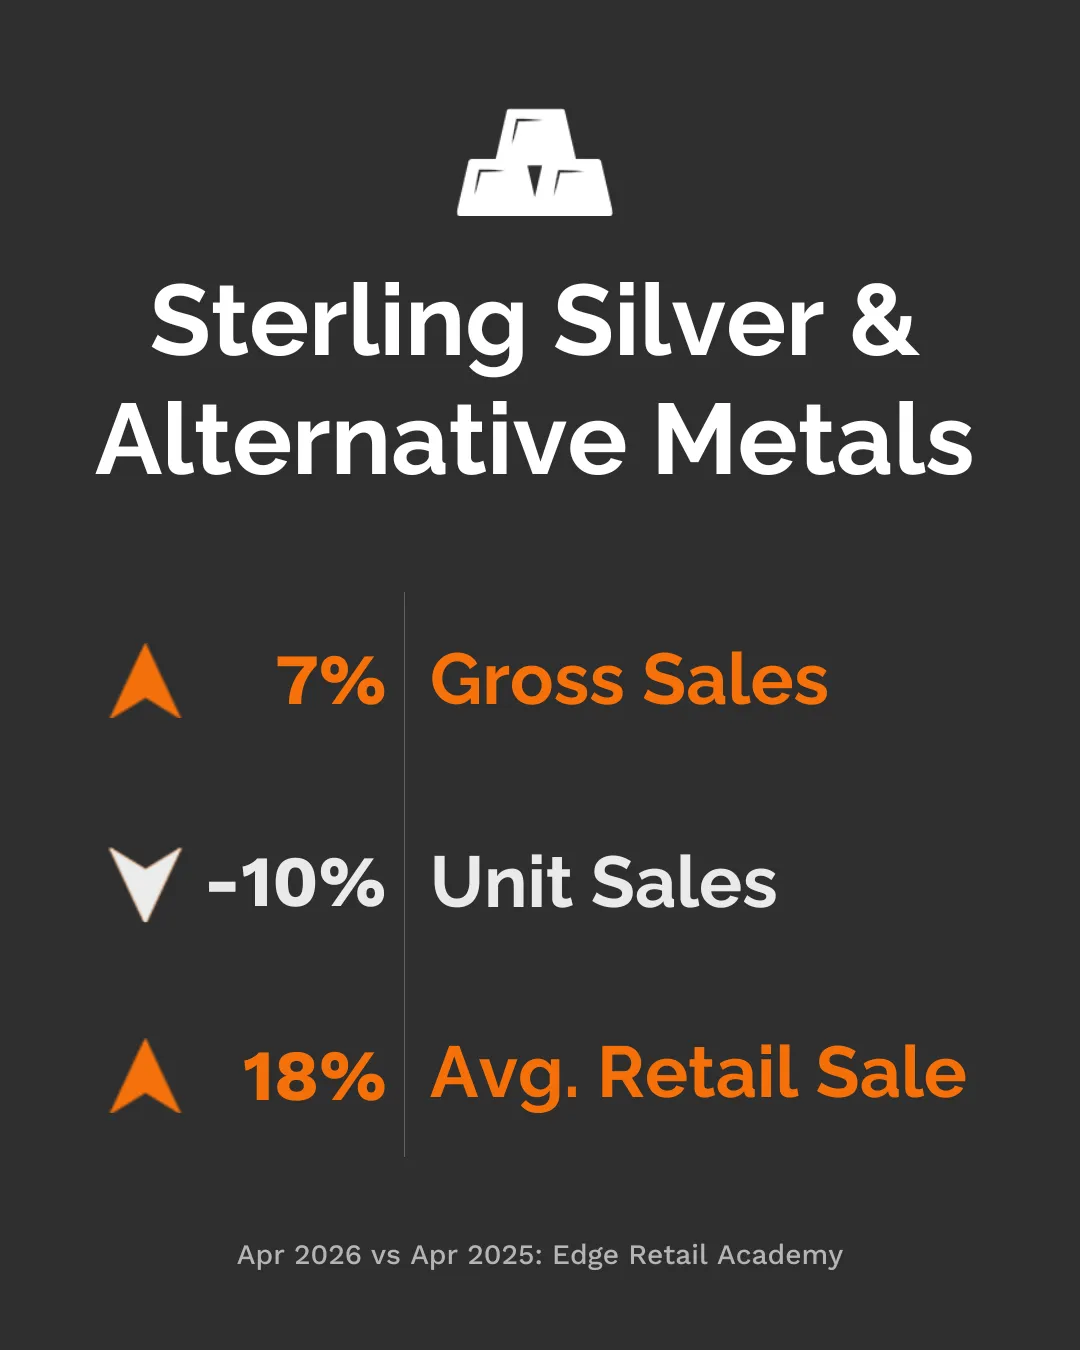
Silver and alternative metals saw a 7% increase in sales, with units down 10% and average retail sale up 18%, suggesting continued softness in volume offset by higher ticket values.
Overall, April reflects a continuation of a higher-value sales environment. Revenue growth remains intact, but it is being driven by increased transaction value rather than unit expansion.
 |
 |
 |
 |
Not sure how your store’s performance compares?
A complimentary Store Performance Analysis provides a clear, data-driven view of how your business is performing and where opportunities may exist to improve results.
You’ll receive a personalized review focused on:
- Overall sales performance
- Inventory health and stock turn
- Sales team effectiveness
- Opportunities to strengthen profitability and cash flow
Request your complimentary analysis here